编号:CDUT-2021-47
中文标题:桥墩防护结构系统对两相泥石流尾流的影响
英文标题:Effects of defense-structure system for bridge piers on two-phase debris flow wakes
入藏号:WOS:000672952700002
中国科学院文献情报中心期刊分区(升级版):工程技术1区/TOP
作者:陈政,何思明,沈伟,王东坡*
来源出版物: Acta Geotechnica
出版年:2021年
第一地址:成都理工大学
关键词:桥墩,泥石流尾流,防护结构,数值模拟,两相泥石流
代表图:
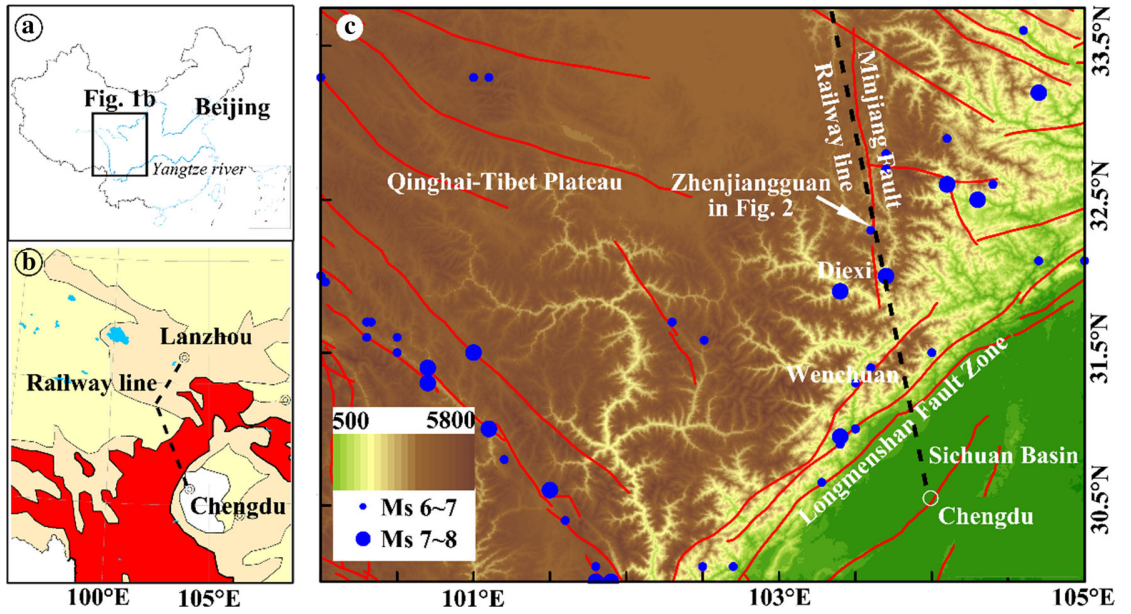
图1. 所研究区域处于四川盆地与青藏高原之间。(a)为研究区地理位置;(b)为所研究铁路沿线跨越的泥石流风险区域,其中红色代表高风险,黄色代表低风险;(c)为研究区内的地形地质条件,包括活动断层走向、历史地震发生位置与震级、以及镇江关泥石流空间位置。
Fig. 1 Location map of the studying area between the western Sichuan Basin and the southeast Qinghai-Tibet Plateau. a Shows the studying area.b Presents the railway lines from Chengdu to Lanzhou, and the debris-flow risk map [77], in which the red and yellow areas are high-prone and low-prone areas, respectively. c Presents the topographic features and the locations of some fault zones, earthquakes and Zhenjiangguan debris flow in the studying area.
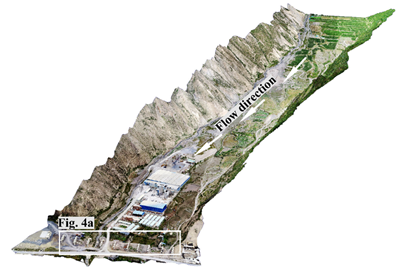
图2. 镇江关泥石流沟三维地形图像。其中白色框线内为位于下游泥石流堆积区的桥墩与泥石流防护结构群。
Fig. 2. 3D image of Zhenjiangguan debris-flow gully. Downstream inside the white box is the defense structures and the line of bridge crossing the debris-flow accumulation region
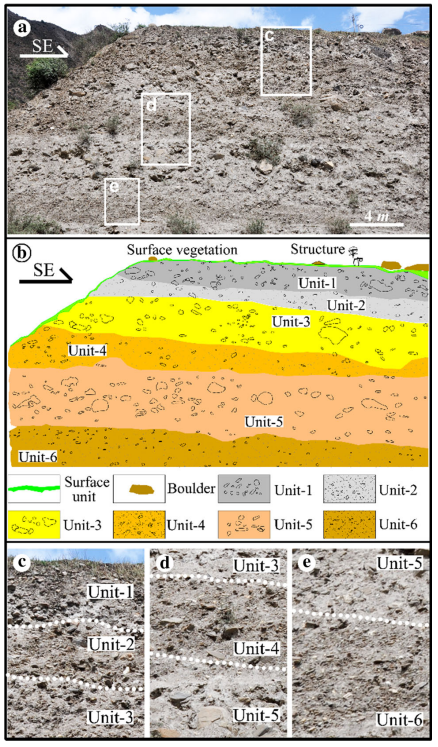
图3. 研究泥石流沟的沉积剖面结构。图(a)与(b)分别为位于镇江关泥石流沟下游左岸的剖面照片及其相应的结构简图。图(c)、(d)与(e)为局部放大图像,其显示了六个不同沉积层单元Unit-1到Unit-6。其中,Unit-1, Unit-3 与Unit-5沉积物颗粒粒径较大,而Unit-2, Unit-4 与Unit-6沉积物颗粒相对较小。
Fig. 3 Deposition profile of debris flow. a Photograph and b corresponding sketch of the deposit profile at the left bank down -stream of the Zhenjiangguan debris flow. c and d Photographs of interfaces of different debris-flow events. Units 1 to 6 are different debris-flow deposit layers with obvious interfaces, in which Unit-1, Unit-3 and Unit-5 contain larger-size grains, while the particle sizes of Unit-2,Unit-4 and Unit-6 are relatively smaller
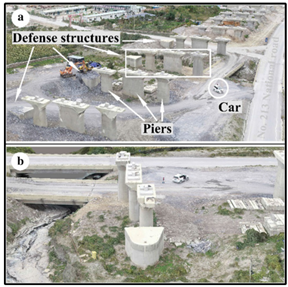
图4. 防护结构与桥梁桥墩结构。图(a)为泥石流堆积扇上结构群分布的斜视图;(b)为单体防护结构与其后桥墩结构的三维图像。
Fig. 4 Defense structures and bridge piers. a Oblique view of the structural distribution in debris-flow fan, and b 3D image of defense structure and piers
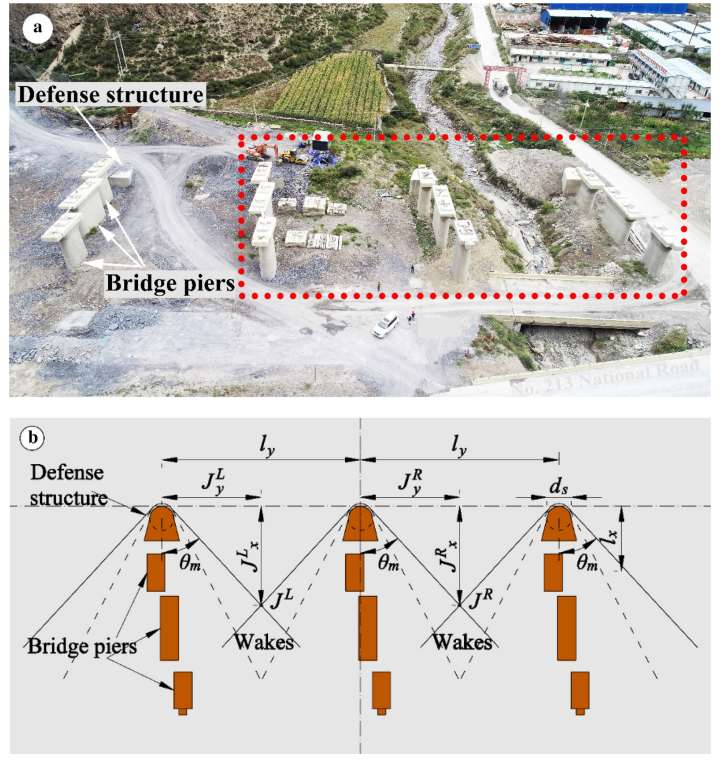
图5. 泥石流防护结构与桥墩的俯视图。图(a)为无人机摄影;图(b)为泥石流冲击绕流防护结构群的“V”型尾流结构。图中,Jx, Jy为相邻尾流相互作用区域中心坐标;lx, ly为结构的纵向间距与横向间距;θm为“V”型尾流半锥角;图(b)中横轴与纵轴分别为y轴和x轴。
Fig. 5 Overhead view of debris-flow defense structures and piers used in engineering practice, and its corresponding functional sketch. a Drone aerial pictures and b V-shape wakes diagram of debris flow passing through defense structures and piers. Jx, Jy are the center locations of the intersection. lx and ly are row spacing and column spacing of structures, respectively. θm is half cone angle of the V-shape debris-flow wakes. The horizontal and vertical axes in b are y-axis and x-axis (dash-dot lines), respectively
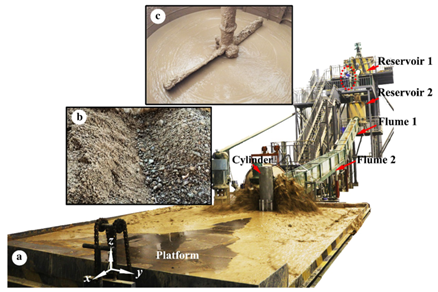
图6. 泥石流实验系统。图(a)为泥石流室内模拟系统,其由两个物料池,两个水槽以及一个堆积平台组成。图(a)展示了在实验过程中,泥石流冲击圆柱形桥墩形成冲击爬高。图(b)实验所用的颗粒材料,其由粗砾石与砂颗粒构成。图(c)泥石流物理模拟实验用的混合物,由物料池1搅拌形成。
Fig. 6 Debris-flow experimental system. a Presents an indoor debris-flow simulation system that consists of two reservoirs, two flumes and one accumulation platform, showing the oblique view of debris-flow runup when debris flow impacts a cylinder model. b Shows the granular material used in the experiment. It consists of gravels and sand particles. c Shows the water-grain-clay mixture being stirred in Reservoir 1
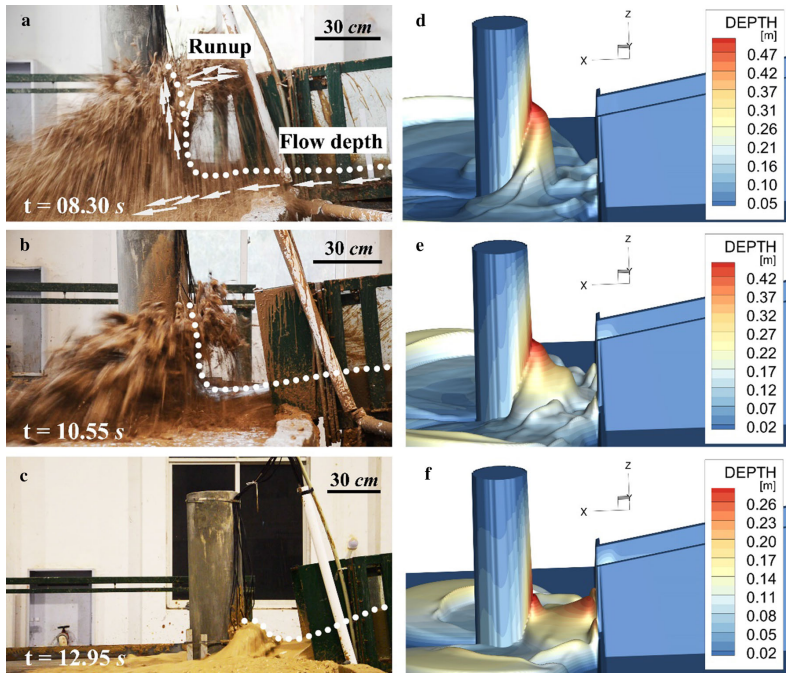
图7. 在不同泥石流实验下,物理模型实验和数值模拟实验的对比图。图(a)、(b)、(c)分别为实验1、实验2、实验3条件下的实验结果和模拟结果。
Fig. 7 Comparison of experimental and numerical results for different debris-flow experiments. a–c Experimental results for Exp. 1, Exp. 2 and Exp. 3 debris flows, respectively. d–f Corresponding numerical simulations
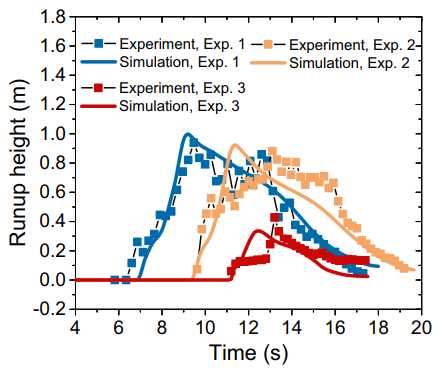
图8. 实验1、实验2、实验3条件下泥石流冲击桥墩的实验爬高值和模拟爬高值。
Fig. 8 Comparison of experimental and numerical runup heights in the impact region for Exp. 1, Exp. 2 and Exp. 3 debris flows, respectively. The points and lines colored blue, red and black represent the experimental and numerical runup, respectively
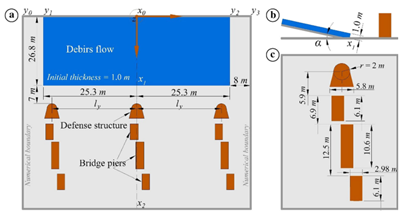
图9. 模拟初始条件示意图。图(a)防护结构、桥墩以及泥石流初始质量;图(b)侧视图;图(c)结构尺寸。
Fig. 9 Sketch of the initial configuration: a aerial view of the defense structures, piers and initial mass of debris flow, b side view of slope and c detailed information of structural sizes
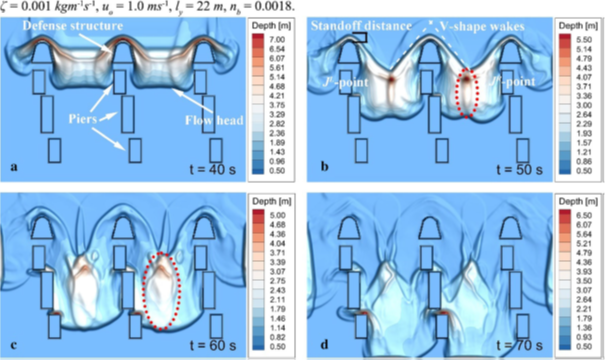
图10. 泥石流冲击、绕流防护结构群演化过程;图(a)至(d)分别为40 s, 50 s, 60 s and 70 s的厚度分布,其中时间开始于泥石流头部距离防护结构表面7 m位置处。模拟用的相关参数见表2中的序号No.1。图中单位为m。
Fig. 10 Time series of the evolution of debris flowing through defense structures and piers. a–d are the debris-flow depth distributions at 40 s,50 s, 60 s and 70 s, respectively. Time begins when debris-flow head is 7 m from the front surface of the defense structures. The values of
parameters used for simulation correspond to No. 1 in Table 2. The dimensions used for debris-flow depth are in meters (m)
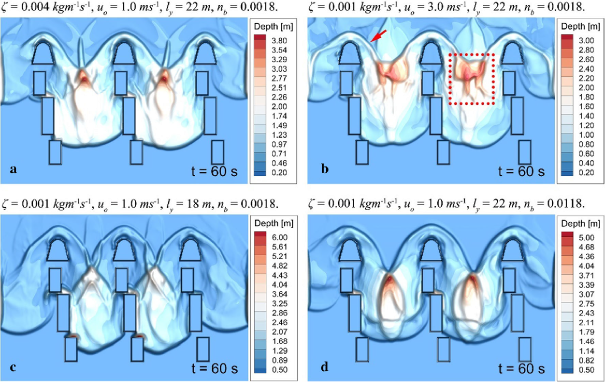
图11. 不同模拟条件下,计算时间为60 s的厚度分布。时间开始于泥石流头部距离防护结构表面7 m位置处。(a)到(d)模拟用的相关参数分别见表2中的序号No. 3, No. 7, No. 11 and No. 15。图中所有单位为m。
Fig. 11 Thickness distribution of debris flow at 60 s under the conditions of different parameters. Time begins when debris-flow head is 7 m from the front surface of the defense structures. The parameters used for a–d correspond to the values of No. 3, No. 7, No. 11 and No. 15 in Table 2, respectively. All dimensions are in meters (m)
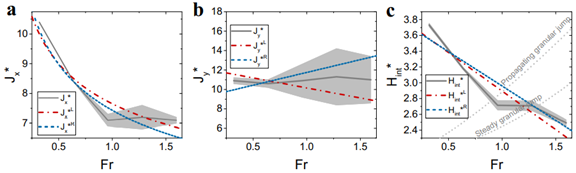
图12. Fr对泥石流尾流的影响。(a)至(c)为Jx* –Fr, Jy* –Fr 以及Hint* –Fr的关系图。图中,灰色实线为Jx* , Jy* 以及Hint*的平均值;红色和蓝色虚线分别为左、右泥石流尾流的拟合值。
Fig. 12 The effects of Fr on debris-flow wakes. a–c are the relationships of Jx* –Fr, Jy* –Fr and Hint* –Fr, respectively. The gray solid line for each figure represents the mean value of Jx* , Jy* and Hint* calculated by the values of the left and the right side. The red dot-dash line and blue dotted line are the fitting lines for the left and right debris-flow wakes, respectively
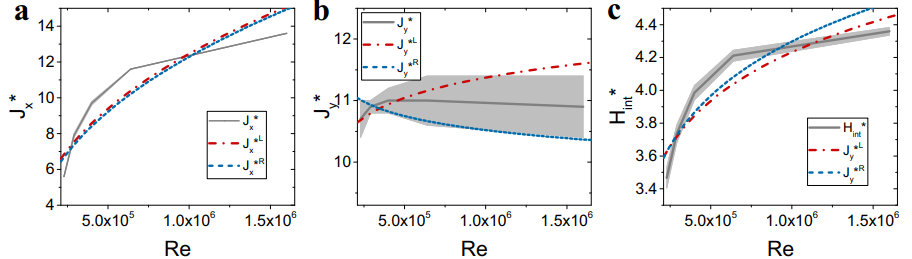
图13. Re对泥石流尾流的影响。(a)至(c)为Jx* –Re, Jy* –Re以及Hint* –Re的关系图。
Fig. 13 The effects of Re on debris-flow wakes. a–c are the relationships of Jx* –Re, Jy* –Re and Hint* –Re, respectively
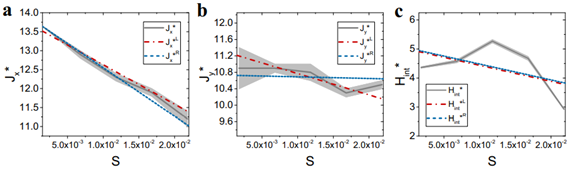
图14. S对泥石流尾流的影响。(a)至(c)为Jx* –S, Jy* –S以及Hint* –S的关系图。
Fig. 14 The effects of S on debris-flow wakes. a–c are the relationships of Jx* –S, Jy* –S and Hint* -S, respectively
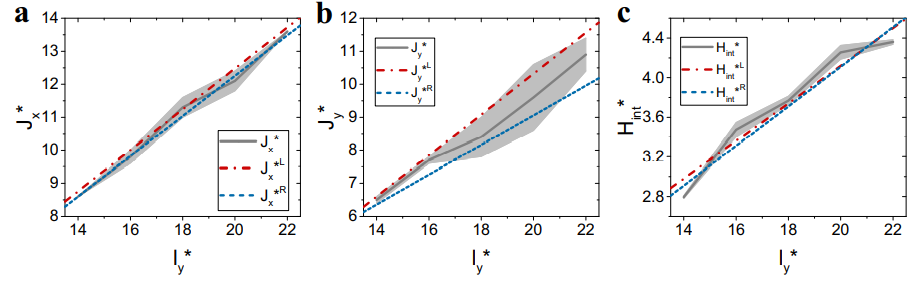
图15. ly*对泥石流尾流的影响。(a)至(c)为Jx* –ly*, Jy* –ly*以及Hint* –ly*的关系图。
Fig. 15 The effects of ly* on debris-flow wakes. a–c are the relationships of Jx* –ly* , Jy* –ly* and Hint* –ly* , respectively
摘要:泥石流防护结构通常建造在桥墩的上游位置处,用以减轻泥石流潜在的冲击影响。在本研究中,通过实地调查,获取到一次典型泥石流事件的工程地质条件以及相关工程结构的几何布置。采用固-液两相泥石流模型,模拟研究了泥石流冲击绕流一组防护结构群的动态演化过程,重点关注了其从防御结构上脱离出来的“V”型冲击尾流,并进行了数值研究。结果表明,由于相邻尾流的动力相互作用,形成了椭圆形的两相流体结构,且这种流体结构的形状与流体粘度、冲击速度、基底摩擦以及结构几何分布具有相关性。具体来讲,流体结构的中心位置和最大厚度与弗劳德数、雷诺数、曼宁摩擦数以及防御结构的横向间距呈非线性或线性相关。最终,本研究进一步提高了工程或科研人员在防护结构体系对两相泥石流动力学影响上的相关认识,可为泥石流风险区内的工程结构优化设计提供响应的科学依据。
文章链接地址: https://link.springer.com/article/10.1007%2Fs11440-021-01296-5